I check my agent's activity feed the same way I check Slack in the morning. Coffee in hand, scroll through what happened overnight, flag anything weird, move on. Two minutes.
But those two minutes are load-bearing. They're the difference between catching a misconfigured deployment at 9 AM and discovering it from a customer ticket at 3 PM. This guide covers what AI agent monitoring actually means in practice: what you look for, how risk levels work, and why your audit trail needs to live somewhere your agent cannot reach. It also covers the log deletion problem that most teams miss.
How AI Agent Monitoring Works: From Event to Alert
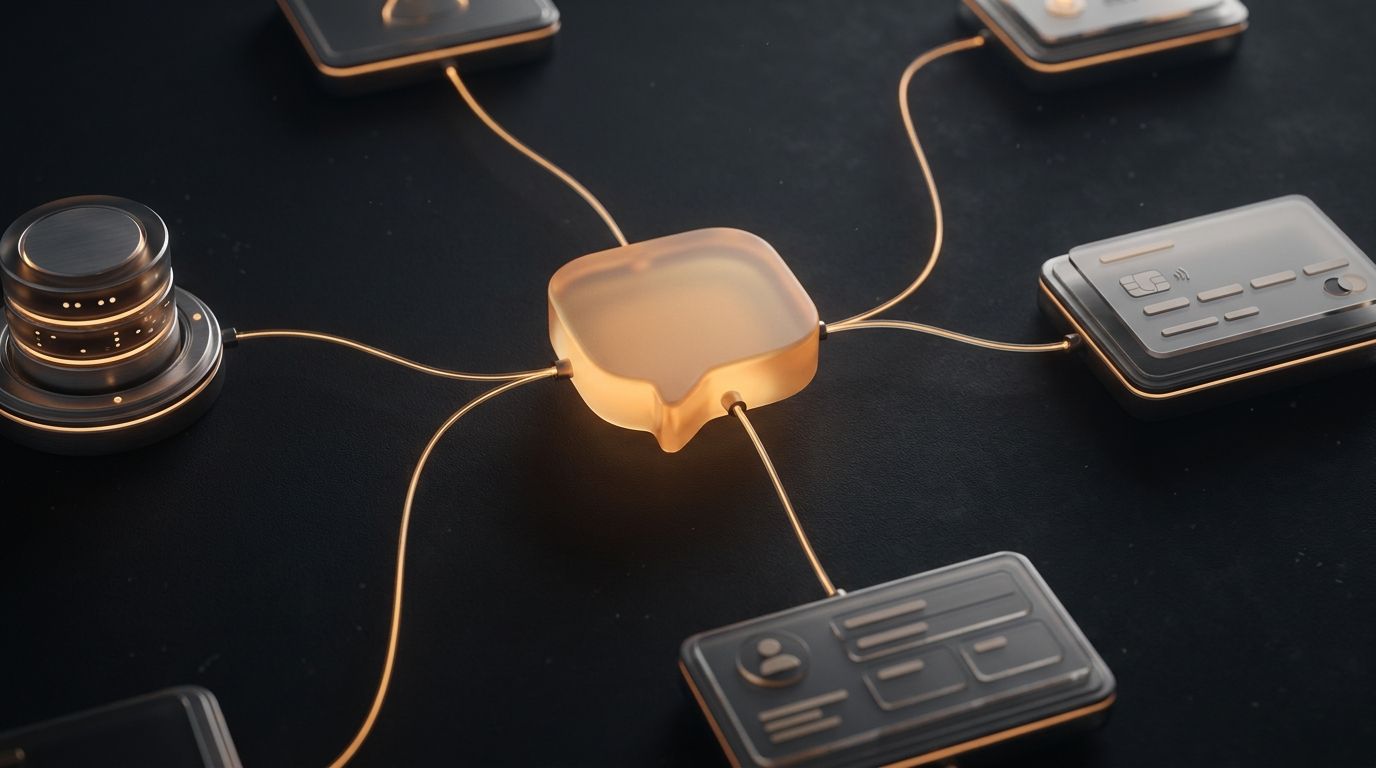
Every MCP tool call your OpenClaw agent makes passes through four stages before it appears in your activity feed:
The key detail: logs are written to independent storage, not on the same filesystem the agent can access. That distinction's load-bearing. More on it in the log deletion section below.
A Typical Day with 5 MCP Servers
I run 5 MCP servers in my workspace: Postgres, GitHub, Slack, filesystem access, and a custom internal API. Each one logs every tool call, every action, every interaction with external systems.
Here is what a real morning looks like:
09:47 — Postgres / SELECT query / Low risk
09:48 — GitHub / list pull requests / Low risk
09:49 — Slack / read channel history / Low risk
09:51 — Filesystem / read config.json / Low risk
09:52 — GitHub / create comment / Medium risk
10:15 — Postgres / INSERT user record / Medium risk
10:31 — GitHub / merge pull request / Medium risk
10:45 — Filesystem / write deployment manifest / Medium risk
11:02 — Postgres / ALTER TABLE / High risk
11:03 — Custom API / call with API key / High risk
That is 47 tool calls in one day across all servers. Most of them are reads, noise you can safely ignore. A handful are writes that need a quick scan. Maybe one or two hit that orange high-risk zone and actually deserve attention.
Full disclosure: I built Aerostack, so I can see exactly what is happening under the hood. If I'm building this workflow for my own agents, I am building it for yours too.
Risk Levels for AI Agent Monitoring, Explained Practically
When I look at the activity log, I am not reading every entry. I scan by risk level.
Low risk (green): Read operations and list queries. Anything that only observes the world without changing it. This is noise. I scroll past it unless the volume spikes unexpectedly.
Medium risk (amber): File writes and command executions. Config changes. Database inserts. These are fine. Agents need to do things. Worth a quick glance: did that write go to the right file? Did that command finish in a reasonable time?
High risk (orange): Deployments. Package installs. Credential use. When your agent is accessing secrets or touching production infrastructure, you want to know about it. I scan every one of these during my morning review.
Critical risk (red): Destructive operations: rm -rf, DROP TABLE, repository deletion. These should never be silent. A critical action should trigger an approval gate before it runs, not after.
No Monitoring vs. a Real-Time Activity Feed
Most teams running AI agents start without any monitoring. Here is what that costs:
| No monitoring | Real-time activity feed | |
|---|---|---|
| Incident discovery | Customer ticket or broken deploy | Morning 2-minute review catches it same day |
| Root cause analysis | Guess from application logs, no tool-level detail | Exact tool call, timestamp, arguments, and source client on record |
| Credential misuse | Invisible. No record of which agent used which secret. | Every credential access logged with risk level |
| Audit trail integrity | Agent can delete its own logs | Independent immutable storage the agent cannot reach |
| Multi-client visibility | No way to tell OpenClaw from Claude Code from a custom bot | Per-client attribution on every event |
| Destructive operations | Happen silently. Discovered after the fact. | Critical threshold triggers approval gate before execution |
The Log Deletion Problem: Why Your Audit Trail Must Be External
This is the part most teams don't catch until something goes wrong.
The chain of logic is uncomfortable but airtight. Your agent has filesystem access. That is the whole point: it needs to read and write files. Your logs are stored as files on the local machine. Your agent can access those files. Therefore your agent can delete or overwrite its own logs.
There is no independent record.
This is especially sharp when an agent makes a mistake. Maybe it hallucinates and runs rm -rf in the wrong directory. Maybe it corrupts a database. If the logs vanish, you cannot debug the failure. You just know something broke.
The community has built solid retrospective dashboards for OpenClaw: Mission Control, OpenClaw Dashboard, openclaw.watch. They are good for understanding what happened yesterday. But they all share one limitation: they read from local log files. If an agent modifies those files, the dashboard is blind.
Aerostack's AI agent monitoring stores every event in independent storage, external to the agent's filesystem, append-only, and inaccessible to the agent itself. The agent cannot touch these logs. Your audit trail exists whether the agent wants it to or not.
This is not paranoia. It is design. An agent with filesystem access is effective precisely because it can do real work. That same access means it can hide. The only defense is a tamper-evident audit trail it cannot reach.
The Events That Actually Matter in Your Activity Feed
My personal priority list: the subset of the activity feed I actually care about during a review.
Command execution. Shell commands can do anything. If your agent is running bash or exec, you need to see what command it ran and whether it succeeded or failed.
File deletes. Irreversible. If something deletes a file on disk or in a database, I want that in my review. Even if it is correct behavior, I want to confirm it.
Credential use. If your agent is accessing a secret, say an API key or OAuth token, that's notable. Not because it's wrong, but because it's a chokepoint. If an attacker has your workspace access, credential use is how they pivot to other systems.
Deployments. Code going live changes the blast radius of everything else. If your agent deploys, that is top of my list.
Everything else. Read operations and successful writes to expected paths. I mostly ignore these unless something looks abnormal.
Filtering Strategies for Agent Observability
The activity log gets noisy fast. Here is how I cut through it:
Filter by risk level. Start with High and Critical. Work down to Medium if you have time. Skip Low entirely unless you suspect a bug.
Filter by workspace. If you have separate workspaces for development, staging, and production, filter by the one you are reviewing. Production activity mixed in with test noise hides what's important.
Filter by time. When you come back from a break, check last hour. For your morning review, last 24 hours. If something went wrong yesterday, zoom in on a specific window and see exactly what happened.
These filters stack. "Show me High-risk actions in production from the last hour" returns the three most important things you need to know about right now.
When Multiple AI Apps Hit the Same Workspace
OpenClaw is not the only thing that touches your workspace. You might also have Claude Code connected, or a Cursor agent, or a custom bot. When that happens, the activity feed tells you which client made each call:
11:30 — OpenClaw agent-xyz / Postgres SELECT / Low risk
11:31 — Claude Code session-abc / Slack post / Medium risk
11:32 — OpenClaw agent-xyz / GitHub merge / High risk
This is useful for debugging. If something unexpected happened, you can ask: who triggered that deployment? The activity feed has the answer. You can also filter by client. If you are only interested in what OpenClaw did, you filter out Claude Code and Cursor entirely.
The 2-Minute AI Agent Monitoring Workflow
You don't need to watch the activity feed constantly. That is not scalable. The workflow is simpler:
1. Set up approval gates for critical actions. These fire automatically when the threshold is crossed, before execution. You do not have to catch them in the morning review.
2. Morning review: scan High and Critical. Filter to the last 24 hours, filter to High+. Confirm everything looks normal. Two minutes.
3. Dig in when something looks off. A deploy that should not have happened. A file write to the wrong path. An unusual command. Click into the event, see what the agent was trying to do, check the logs, understand the failure or success.
Most mornings you'll scroll through, see reads and normal writes, and confirm everything is working as designed. That confirmation is the point. You are not watching for disaster. You are building the habit of knowing what your agents are doing.
AI agent monitoring is one layer of a full observability stack. For the complete picture, see the computer use agent overview at OpenClaw, then the security-specific posts below.
See the OpenClaw agent management complete guide for full setup, workspaces, and server configuration.
Read the exposed OpenClaw instances security hardening guide to lock down your workspace before connecting MCP servers.
Review OpenClaw security hardening and tool block controls for per-tool allow/deny rules that reduce attack surface.
Add real-time AI agent monitoring, risk-scored activity feeds, tamper-evident audit logs, and approval gates to your OpenClaw workspace. Every tool call logged to independent storage your agents cannot touch.
Frequently Asked Questions
AI Agent Monitoring
What is AI agent monitoring?
AI agent monitoring is the practice of recording and reviewing every action an AI agent takes: tool calls, file writes, deployments. Each event gets a risk level and a timestamp. A monitoring system gives you a tamper-evident audit trail so you can verify what your agent did and respond before issues reach production.
Why does my OpenClaw agent need external monitoring?
OpenClaw agents with filesystem access can technically delete or overwrite local log files. External monitoring stores events in independent storage the agent cannot reach, ensuring your audit trail is complete even if the agent misbehaves or gets compromised.
What risk levels does Aerostack assign to agent actions?
Four levels: Low (reads and list operations), Medium (writes, config changes, database inserts), High (deployments, credential access, package installs), and Critical (destructive operations like rm -rf or DROP TABLE). Critical actions trigger approval gates before executing.
How long does the morning activity review take?
Two minutes for a typical day. Filter to High and Critical in the last 24 hours, scan the list, confirm nothing looks anomalous. Most mornings you will see zero surprises. The review builds situational awareness over time so you start recognizing normal patterns and noticing deviations immediately.
Can I monitor multiple AI clients in the same activity feed?
Yes. Aerostack's activity feed attributes every event to the source client, so you can see which AI application made which tool call. You can filter to a single client or compare activity across OpenClaw, Claude Code, and Cursor side by side.
How is AI agent monitoring different from AI agent observability?
AI agent monitoring is specifically about real-time activity feeds, risk levels, and audit trails — tracking what an agent did and flagging anything that needs attention. AI agent observability is a broader term covering tracing, evaluation, cost metrics, and replay of specific sessions. Think of monitoring as the operational layer (is anything wrong right now?) and observability as the analytical layer (why did the agent behave this way?). This post covers monitoring. A separate guide covers the tracing and evaluation side.